Butterwort filter#
- filters.frequency.butter(data, f_low, f_high, fs, order, zero_phase=True)#
Create a butterworth filter and applies it to the input data.
- Parameters:
data (list or np.ndarray, len(sample_cnt)) – Single vector of input data
f_low (float) – Start of filters’s pass band.
f_high (float) – End of the filters’s pass band.
fs (float) – Sampling frequency
order (int) – Order of the filters.
zero_phase (boolean) – If ‘true’ the filters is applied forwards and backwards resulting in zero phase distortion.
- Returns:
Filtered data.
- Return type:
list or np.ndarray
The following code example shows how to apply the butterwort filter.
import numpy as np
import random
import matplotlib
matplotlib.use("Qt5agg")
import matplotlib.pyplot as plt
import finn.filters.frequency as ff
#Configure sample data
channel_count = 1
frequency = [random.randint(5, 50) for _ in range(channel_count)]
data_range = np.arange(0, 10000)
frequency_sampling = 200
#Configure noise data
frequency_noise = 50
shared_noise_strength = 10
random_noise_strength = 1
#Generate some sample data
raw_data = [None for _ in range(channel_count)]
for ch_idx in range(channel_count):
genuine_signal = np.sin(2 * np.pi * frequency[ch_idx] * data_range / frequency_sampling)
shared_noise_signal = np.sin(2 * np.pi * frequency_noise * data_range / frequency_sampling) * shared_noise_strength
random_noise_signal = np.random.random(len(data_range)) * random_noise_strength
raw_data[ch_idx] = genuine_signal + shared_noise_signal + random_noise_signal
raw_data = np.asarray(raw_data)
#Filter data - butter
filtered_butter_data = [None for _ in range(channel_count)]
for ch_idx in range(channel_count):
filtered_butter_data[ch_idx] = ff.butter(raw_data[ch_idx], 1, 40, frequency_sampling, order = 7, zero_phase = True)
filtered_butter_data = np.asarray(filtered_butter_data)
#Filter data - fir
filtered_fir_data = [None for _ in range(channel_count)]
for ch_idx in range(channel_count):
filtered_fir_data[ch_idx] = ff.fir(raw_data[ch_idx], 52, 48, 0.1, frequency_sampling, ripple_pass_band = 1e-5, stop_band_suppression = 1e-7, fft_win_sz = frequency_sampling, pad_type = "zero")
filtered_fir_data = np.asarray(filtered_fir_data)
#visualize result
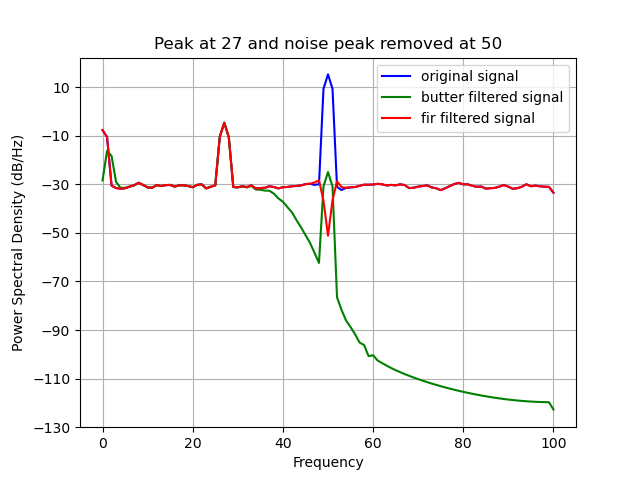
plt.title("Peak at %i and noise peak removed at %i" % (frequency[0], frequency_noise))
plt.psd(raw_data[0, :], NFFT = frequency_sampling, Fs = frequency_sampling, color = "blue", label = "original signal")
plt.psd(filtered_butter_data[0, :], NFFT = frequency_sampling, Fs = frequency_sampling, color = "green", label = "butter filtered signal")
plt.psd(filtered_fir_data[0, :], NFFT = frequency_sampling, Fs = frequency_sampling, color = "red", label = "fir filtered signal")
plt.legend()
plt.show(block = True)
Applying the butterwort filter (green) notched the noise at 50Hz.