Topoplot#
- visualization.topoplot.Topoplot(signal_type: str)#
Topoplot generation class.
Initialization costs a couple of seconds due to mask generation. Performance advice: if possible, only generate a single topoplot object.
Constructor. Currently supports: The extended 10-20 system for 64 channels - ext_10_20_64_ch
- visualization.topoplot.topoplot_mask_data#
Whether to mask channels.
- Type:
np.ndarray
- visualization.topoplot.default_v_diff#
default value for v_diff.
- Type:
float
- visualization.topoplot.win_sz#
Default window size.
- Type:
float
- visualization.topoplot.get_coords#
Function to reat the coordinates.
- Type:
callable
- visualization.topoplot.signal_type#
Signal type is either “EEG” or “MEG”
- Type:
str
- Parameters:
signal_type (str) – Signal type is either “EEG” or “MEG”
- Raises:
NotImplementedError – If signal_type is neither ‘EEG’ nor ‘MEG’.
- visualization.topoplot.Topoplot.run(self, values, ch_name_list, omit_channels=None, substitute_channels=None, v_min=None, v_max=None, v_border_values=None, v_border_labels=None, file_path=None, screen_channels=False, annotate_ch_names=False, ax=None)#
Plot a 2D topomap.
- Parameters:
values (np.ndarray, shape(ch_cnt, 1 or 3)) – May either be a N x 3 or N x 1 matrix. Dimensions #2 (boolean only) may be used to indicate significance before multiple comparison correction and dimensions #3 (boolean only) may be used to indicate significance after multiple comparison correction.
ch_name_list (list) – Names of the individual channels. Used for the spatial positioning of channels and the annotation of channels.
omit_channels (list) – A list which channels are to be omitted. Channels are identified via names matching the ones specified in ch_names.
substitute_channels (dict) – A list of dictionaries. Each dictionary contains a ‘tgt’ section with a single string defining the channel to be substituted and a second ‘src’ section which contains a list of strings, defining channel names which are used to substitute the ‘tgt’ channel.
v_min (float) – Minimal value on the color bar. If None, v_min is chosen as the minimum value within the data.
v_max (float) – Maximuim value on the color bar. If None, v_max is chosen as the maximum value within the data.
v_border_values (list) – Where to put new ticks onto the color bar. v_min and v_max are always added as values. The number of labels defined in v_border_labels must be exactly one element larger than the number of elements in v_border_values.
v_border_labels (list) – Labels for the ticks on the color bar. The number of labels defined in v_border_labels must be exactly one element larger than the number of elements in v_border_values.
file_path (str) – Path (including file name and file ending) were the file is stored. In case of None, the file is not saved.
screen_channels (boolean) – If true, channels are not drawn as a smoothed 2D plane, but a voroni diagram easening the identification of individual unexpected results.
annotate_ch_names (boolean) – If true, channels get annotate with their individual names.
ax (matplotlib.axes.Axes) – Provide an axis object to embed the topoplot into.
- Returns:
- axesmatplotlib.axes.Axes
The axes object to easen the inclusion of a plot into a larger picture.
- figmatplotlib.axes.Axes
The figure object.
- Return type:
matplotlib.pyplot.figure or tuple of (matplotlib.axes.Axes, matplotlib.pyplot.figure)
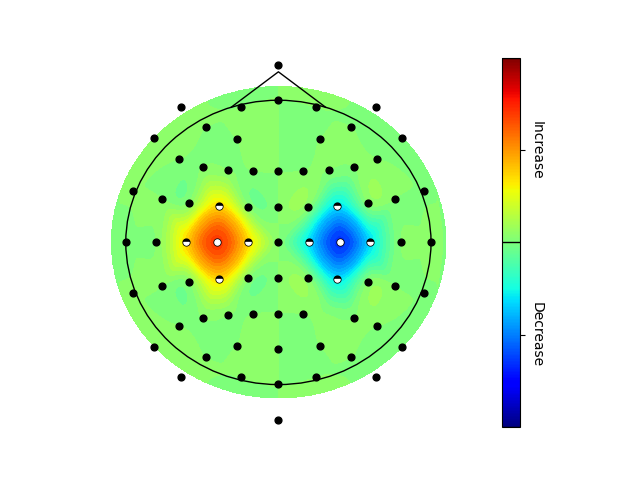
The following code example shows how to create a topoplot.
import numpy as np

import matplotlib
matplotlib.use("Qt5agg")
import matplotlib.pyplot as plt

import finn.visualization.topoplot as tp

##Generate some demo data
#Values to be plotted
values_1 = [                        0,
                                0,  0,  0,
                0,  0,      0,      5,      0,      0, 0, # <-- Omitting this blob (5)
                0,  0,  0,  0,  0,  0,  0,  0,  0,  0, 0,
                0,  0,  0,  1,  0,  0,  0, -1,  0,  0, 0,
                0,  0,  1,  2,  1,  0, -1, -2, -1,  0, 0,
                0,  0,  0,  1,  0,  0,  0, -1,  0,  0, 0,
                0,  0,  0,  0,  0,  0,  0, -5,  0,  0, 0, # <-- Substituting this blob (-5)
                0,  0,      0,      0,      0,      0, 0,
                                0,  0,  0,
                                    0]

#Significance values before multiple comparison correction (boolean)
values_2 = [                        0,
                                0,  0,  0,
                0,  0,      0,      0,      0,      0, 0,
                0,  0,  0,  0,  0,  0,  0,  0,  0,  0, 0,
                0,  0,  0,  1,  0,  0,  0,  1,  0,  0, 0,
                0,  0,  1,  1,  1,  0,  1,  1,  1,  0, 0,
                0,  0,  0,  1,  0,  0,  0,  1,  0,  0, 0,
                0,  0,  0,  0,  0,  0,  0,  0,  0,  0, 0,
                0,  0,      0,      0,      0,      0, 0,
                                0,  0,  0,
                                    0]

#Significance values after multiple comparison correction (boolean)
values_3 = [                        0,
                                0,  0,  0,
                0,  0,      0,      0,      0,      0, 0,
                0,  0,  0,  0,  0,  0,  0,  0,  0,  0, 0,
                0,  0,  0,  0,  0,  0,  0,  0,  0,  0, 0,
                0,  0,  0,  1,  0,  0,  0,  1,  0,  0, 0,
                0,  0,  0,  0,  0,  0,  0,  0,  0,  0, 0,
                0,  0,  0,  0,  0,  0,  0,  0,  0,  0, 0,
                0,  0,      0,      0,      0,      0, 0,
                                0,  0,  0,
                                    0]

ch_name_list = [                                        'Nz',
                                               'Fp1',  'Fpz',  'Fp2',
               'AF9',  'AF7',          'AF3',          'AFz',          'AF4',          'AF8', 'AF10',
                'F9',   'F7',   'F5',   'F3',   'F1',   'Fz',   'F2',   'F4',   'F6',   'F8',  'F10',
               'FT9',  'FT7',  'FC5',  'FC3',  'FC1',  'FCz',  'FC2',  'FC4',  'FC6',  'FT8', 'FT10',
                'T9',   'T7',   'C5',   'C3',   'C1',   'Cz',   'C2',   'C4',   'C6',   'T8',  'T10',
               'TP9',  'TP7',  'CP5',  'CP3',  'CP1',  'CPz',  'CP2',  'CP4',  'CP6',  'TP8', 'TP10',
                'P9',   'P7',   'P5',   'P3',   'P1',   'Pz',   'P2',   'P4',   'P6',   'P8',  'P10',
               'PO9',  'PO7',          'PO3',          'POz',          'PO4',          'PO8', 'PO10',
                                                'O1',   'Oz',   'O2',
                                                        'Iz']

omit_channels = ["AFz"]
substitute_channels = [{"src" : ["CP4", "PO4", "P2", "P6"], "tgt" : "P4"},]

v_min = -3
v_max = 3

file_path = "./test.svg"
screen_channels = False
annotate_ch_names = False

v_border_values = [0]
v_border_labels = ["Decrease", "Increase"]

##Visualize demo data

topo = tp.topoplot("EEG")
#Plot w/o significances
topo.run(values_1, ch_name_list, omit_channels, substitute_channels, v_min, v_max, v_border_values, v_border_labels, file_path, screen_channels, annotate_ch_names)
#Plot with significances before multiple comparison correction (MCC) only
topo.run(np.asarray([values_1, values_2]).transpose(), ch_name_list, omit_channels, substitute_channels, v_min, v_max, v_border_values, v_border_labels, file_path, screen_channels, annotate_ch_names)
#Plot with significances after MCC only
topo.run(np.asarray([values_1, values_2, values_3]).transpose(), ch_name_list, omit_channels, substitute_channels, v_min, v_max, v_border_values, v_border_labels, file_path, screen_channels, annotate_ch_names)
plt.show(block = True)
Significance in the topoplot may be (optionally) indicated as significant after multiple comparison correction (mcc), full dots, before mcc correction, half dots, and not significant while effect sizes can be color encoded.