Within Python Cortical Plots#
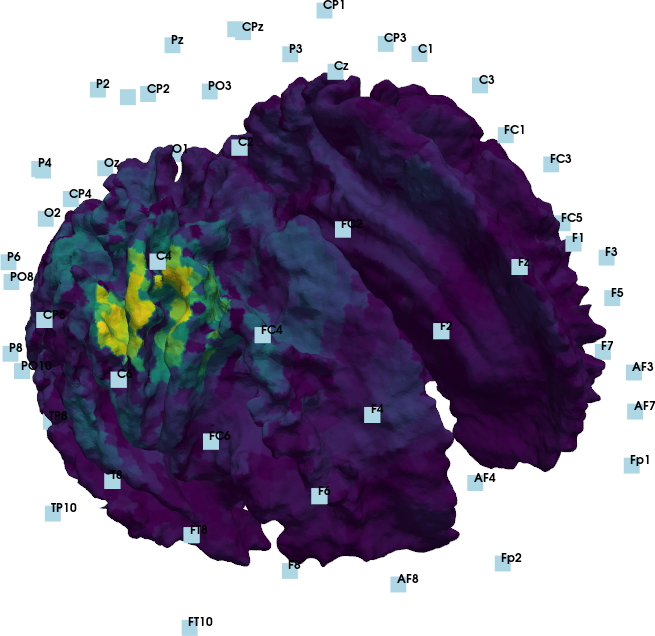
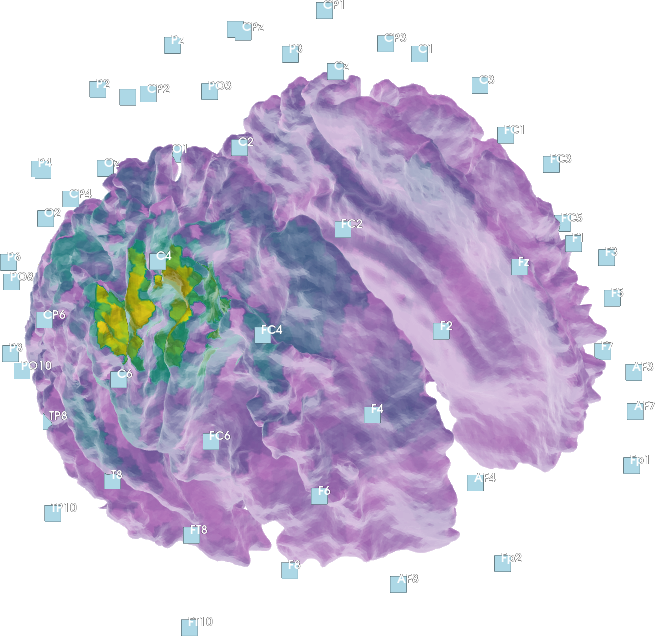
3D topoplots may be generated using pyvista. Depending on whether the visualization happens in subject space, fs-average space, or region-averaged fs-average space, corresponding methods are provided in the visualization module.
plot_subj_space(cort_mdl, color_data, signal_type = None, rec_meta_info = None, coreg = None, ch_names = None)
<or>
plot_fsavg_space(subj_to_fsavg_mdl, color_data, signal_type = None, rec_meta_info = None, coreg = None, ch_names = None)
<or>
plot_reg_avg(subj_to_fsavg_mdl, morphed_channels, color_data, signal_type = None, rec_meta_info = None, coreg = None, ch_names = None)
Of note, all of the above required intermediary byproducts (e.g. cort_mdl) are routinely produced during source reconstruction (see: Downstream Processing).
Alternatively, data may be exported into blender for advanced visualizations (see Within Blender Cortical Plots).