Phase slope index#
This function may be called for data in the time domain, the frequency domain, or (if correctly aligned) in the complex coherency domain.
Note
Use the following function for time domain data.
- feat.sfc.psi_td(data_1, data_2, nperseg_outer, fs, nperseg_inner, nfft, window, pad_type, f_min, f_max, f_step_sz=1, normalize=True)#
Calculate the phase slope index between two signals. Assumes data_1 and data_2 to be from time domain.
- Parameters:
data_1 (np.ndarray or list, len(n_samples)) – First dataset from the complex frequency domain; vector of samples.
data_2 (np.ndarray or list, len(n_samples)) – Second dataset from the complex frequency domain; vector of samples.
nperseg_outer (int) – Outer window size. If normalize = False, this parameter is not used.
fs (float) – Sampling frequency
nperseg_inner (int) – Inner window size.
nfft (float) – FFT window size.
window (str) – FFT window type. Supported window types are listed at https://docs.scipy.org/doc/scipy/reference/generated/scipy.signal.get_window.html.
pad_type (str) – Padding type, currently only “zero” padding is supported.
f_min (float) – Minimum frequency of the frequency range on which coherency gets evaluated.
f_max (float) – Maximum frequency of the frequency range on which coherency gets evaluated.
f_step_sz (float) – Frequency step size in the evaluated interval.
normalize (boolean) – Determines whether to normalize by dividing through the variance.
- Returns:
Connectivity between data_1 and data_2 measured using the phase slope index.
- Return type:
float
Note
Use the following function for frequency domain data.
- feat.sfc.psi_fd(data_1, data_2, bins, f_min, f_max, f_step_sz=1)#
Calculate the phase slope index between two signals. Assumes data_1 and data_2 to be from time domain.
- Parameters:
data_1 (np.ndarray or list, len(n_samples)) – First dataset from the complex frequency domain; vector of samples.
data_2 (np.ndarray or list, len(n_samples)) – Second dataset from the complex frequency domain; vector of samples.
bins (np.ndarray or list, len(bin_cnt)) – Frequency bins.
f_min (float) – Minimum frequency of the frequency range on which coherency gets evaluated.
f_max (float) – Maximum frequency of the frequency range on which coherency gets evaluated.
f_step_sz (float) – Frequency step size in the evaluated interval.
- Returns:
Connectivity between data_1 and data_2 measured using the phase slope index.
- Return type:
float
Note
Use the following function for complex coherency domain data.
- feat.sfc.psi_cc(data, bins, f_min, f_max, f_step_sz=1)#
Calculate the phase slope index between two signals.
- Parameters:
data (list) – List of outer window complex coherency estimates calculated from two signals.
bins (list) – Frequency bins of the sample data.
f_min (float) – Minimum frequence for the evaluated interval.
f_max (float) – Maximum frequence for the evaluated interval.
f_step_sz (float) – Frequency step size in the evaluated interval.
- Returns:
Connectivity estimated based on the provided complex coherency measured using the phase slope index.
- Return type:
float
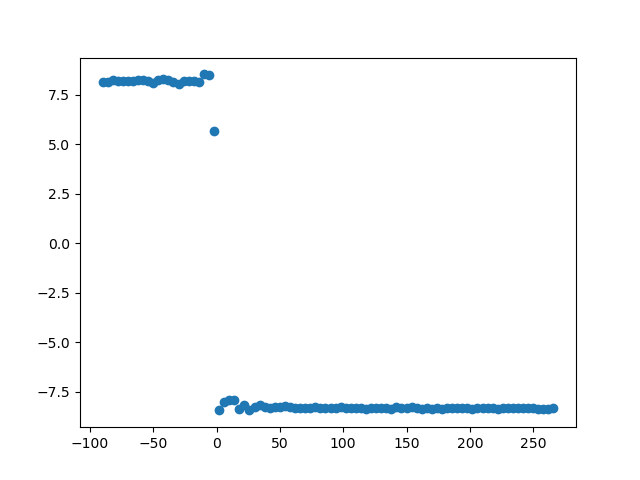
The following code example shows how to apply the phase slope index to measure sfc.
import numpy as np

import matplotlib.pyplot as plt

import finnpy.feat.sfc as sfc  # @UnresolvedImport
import finnpy.demo.functionality.sfc.gen_demo_data as gen_demo_data  # @UnresolvedImport

def main():
   minimum_frequency = 13
   maximum_frequency = 27

   frequency_sampling = 3000
   time_s = 120
   offset_s = 1
   signal_length_samples = int(frequency_sampling * (time_s + offset_s * 2))
   data = gen_demo_data.gen_wn_signal(minimum_frequency, maximum_frequency, frequency_sampling, signal_length_samples)
   frequency_peak = (maximum_frequency + minimum_frequency)/2

   noise_weight = 0.2

   phase_min = -90
   phase_max = 270
   phase_step = 4

   fmin = 18
   fmax = 23

   #Generate data
   offset = int(np.ceil(frequency_sampling/frequency_peak))
   loc_data = data[offset:]
   signal_1 = np.zeros((loc_data).shape)
   signal_1 += loc_data
   signal_1 += np.random.random(len(loc_data)) * noise_weight

   conn_vals = list()
   fig = plt.figure()
   for phase_shift in np.arange(phase_min, phase_max, phase_step):
      loc_offset = offset - int(np.ceil(frequency_sampling/frequency_peak * phase_shift/360))
      loc_data = data[(loc_offset):]
      signal_2 = np.zeros(loc_data.shape)
      signal_2 += loc_data
      signal_2 += np.random.random(len(loc_data)) * noise_weight

      plt.cla()
      plt.plot(signal_1[:500], color = "blue")
      plt.plot(signal_2[:500], color = "red")
      plt.title("Signal shifted by %2.f degree around %2.2fHz" % (float(phase_shift), float(frequency_peak)))
      plt.show(block = False)
      plt.pause(0.001)

      conn_value_td = calc_from_time_domain(signal_1, signal_2, frequency_sampling, fmin, fmax)
      conn_value_fd = calc_from_frequency_domain(signal_1, signal_2, frequency_sampling, fmin, fmax)
      conn_value_coh = calc_from_coherency_domain(signal_1, signal_2, frequency_sampling, fmin, fmax)

      if (np.isnan(conn_value_td) == False and np.isnan(conn_value_fd) == False and np.isnan(conn_value_coh) == False):
          if (conn_value_td != conn_value_fd or conn_value_td != conn_value_coh):
              print("Error")

      conn_vals.append(conn_value_td if (np.isnan(conn_value_td) == False) else 0)

   plt.close(fig)

   plt.figure()
   plt.scatter(np.arange(phase_min, phase_max, phase_step), conn_vals)
   plt.show(block = True)

def calc_from_time_domain(signal_1, signal_2, frequency_sampling, f_min, f_max):
   nperseg_outer = int(frequency_sampling * 3)
   nperseg_inner = frequency_sampling
   nfft = frequency_sampling

   return sfc.psi_td(signal_1, signal_2, nperseg_outer, frequency_sampling, nperseg_inner, nfft, "hanning", "zero", f_min, f_max, f_step_sz = 1)

def calc_from_frequency_domain(signal_1, signal_2, frequency_sampling, f_min, f_max):
   nperseg_outer = int(frequency_sampling * 3)
   nperseg_inner = frequency_sampling
   nfft = frequency_sampling

   fd_signals_1 = list()
   fd_signals_2 = list()

   for idx_start in np.arange(0, len(signal_1), nperseg_outer):

      seg_data_X = sfc._segment_data(signal_1[idx_start:int(idx_start + nperseg_outer)], nperseg_inner, pad_type = "zero")  # pylint: disable=protected-access
      seg_data_Y = sfc._segment_data(signal_2[idx_start:int(idx_start + nperseg_outer)], nperseg_inner, pad_type = "zero")  # pylint: disable=protected-access

      (bins, fd_signal_1) = sfc._calc_FFT(seg_data_X, frequency_sampling, nfft, window = "hanning")  # pylint: disable=protected-access
      (_,    fd_signal_2) = sfc._calc_FFT(seg_data_Y, frequency_sampling, nfft, window = "hanning")  # pylint: disable=protected-access

      fd_signals_1.append(fd_signal_1)
      fd_signals_2.append(fd_signal_2)

   return sfc.psi_fd(fd_signals_1, fd_signals_2, bins, f_min, f_max, 1)

def calc_from_coherency_domain(signal_1, signal_2, frequency_sampling, f_min, f_max):

   nperseg_outer = int(frequency_sampling * 3)
   nperseg_inner = frequency_sampling
   nfft = frequency_sampling

   data_coh = list()

   for idx_start in np.arange(0, len(signal_1), nperseg_outer):

      (bins, cc) = sfc.cc_td(signal_1[idx_start:(idx_start + nperseg_outer)], signal_2[idx_start:(idx_start + nperseg_outer)], nperseg_inner, pad_type = "zero",
                             fs = frequency_sampling, nfft = nfft, window = "hanning")
      data_coh.append(cc)

   return sfc.psi_cc(data_coh, bins, f_min, f_max)

main()
The phase slope index is a reliable measure of connectivity which is commonly normalized via dividing a series of PSI estimates by their variance. Hence, the normalization increases the amount of data needed.