Imaginary coherence#
This function may be called for data in the time domain, the frequency domain, or (if correctly aligned) in the complex coherency domain.
Note
Use the following function for time domain data.
- feat.sfc.ic_td(data_1, data_2, fs, nperseg, nfft)#
Calculate the imaginary coherency between two signals. Assumes data_1 and data_2 to be from time domain.
- Parameters:
data_1 (np.ndarray or list, len(n_samples)) – First dataset from the complex frequency domain; vector of samples.
data_2 (np.ndarray or list, len(n_samples)) – Second dataset from the complex frequency domain; vector of samples.
fs (float) – Sampling frequency
nperseg (float) – Size of individual segments in fft.
nfft (float) – FFT window size.
- Returns:
- binslist
Frequency bins.
- connlist
Coherence values of the respective frequency bins measured via imaginary coherence.
- Return type:
tuple of (list, list)
Note
Use the following function for frequency domain data.
- feat.sfc.ic_fd(data_1, data_2)#
Calculate the imaginary coherency between two signals. Assumes data_1 and data_2 to be from the complex frequency domain.
- Parameters:
data_1 (np.ndarray or list, len(n_samples)) – First dataset from the complex frequency domain; vector of samples.
data_2 (np.ndarray or list, len(n_samples)) – Second dataset from the complex frequency domain; vector of samples.
- Returns:
Connectivity between data_1 and data_2 measured using imaginary coherence.
- Return type:
list
Note
Use the following function for complex coherency domain data.
- feat.sfc.ic_cc(data)#
Calculate the imaginary coherency between two signals. Assumes data_1 and data_2 to be from the complex frequency domain.
- Parameters:
data (list) – Complex coherency values; vector of samples.
- Returns:
Connectivity estimated based on the provided complex coherency measured via the imaginary coherence.
- Return type:
list
The following code example shows how to apply imaginary coherence to measure sfc.
import numpy as np
import matplotlib.pyplot as plt
import finnpy.feat.sfc as sfc # @UnresolvedImport
import finnpy.demo.functionality.sfc.gen_demo_data as gen_demo_data # @UnresolvedImport
def main():
minimum_frequency = 13
maximum_frequency = 27
frequency_sampling = 3000
time_s = 120
offset_s = 1
signal_length_samples = int(frequency_sampling * (time_s + offset_s * 2))
data = gen_demo_data.gen_wn_signal(minimum_frequency, maximum_frequency, frequency_sampling, signal_length_samples)
frequency_peak = (maximum_frequency + minimum_frequency)/2
noise_weight = 0.2
phase_min = -90
phase_max = 270
phase_step = 4
frequency_target = 20
nperseg = frequency_sampling
nfft = frequency_sampling
#Generate data
offset = int(np.ceil(frequency_sampling/frequency_peak))
loc_data = data[offset:]
signal_1 = np.zeros((loc_data).shape)
signal_1 += loc_data
signal_1 += np.random.random(len(loc_data)) * noise_weight
conn_vals = list()
fig = plt.figure()
for phase_shift in np.arange(phase_min, phase_max, phase_step):
loc_offset = offset - int(np.ceil(frequency_sampling/frequency_peak * phase_shift/360))
loc_data = data[(loc_offset):]
signal_2 = np.zeros(loc_data.shape)
signal_2 += loc_data
signal_2 += np.random.random(len(loc_data)) * noise_weight
plt.cla()
plt.plot(signal_1[:500], color = "blue")
plt.plot(signal_2[:500], color = "red")
plt.title("Signal shifted by %2.f degree around %2.2fHz" % (float(phase_shift), float(frequency_peak)))
plt.show(block = False)
plt.pause(0.001)
conn_value_td = calc_from_time_domain(signal_1, signal_2, frequency_sampling, nperseg, nfft, frequency_target)
conn_value_fd = calc_from_time_domain(signal_1, signal_2, frequency_sampling, nperseg, nfft, frequency_target)
conn_value_coh = calc_from_time_domain(signal_1, signal_2, frequency_sampling, nperseg, nfft, frequency_target)
if (np.isnan(conn_value_td) == False and np.isnan(conn_value_fd) == False and np.isnan(conn_value_coh) == False):
if (conn_value_td != conn_value_fd or conn_value_td != conn_value_coh):
print("Error")
conn_vals.append(conn_value_td if (np.isnan(conn_value_td) == False) else 0)
plt.close(fig)
plt.figure()
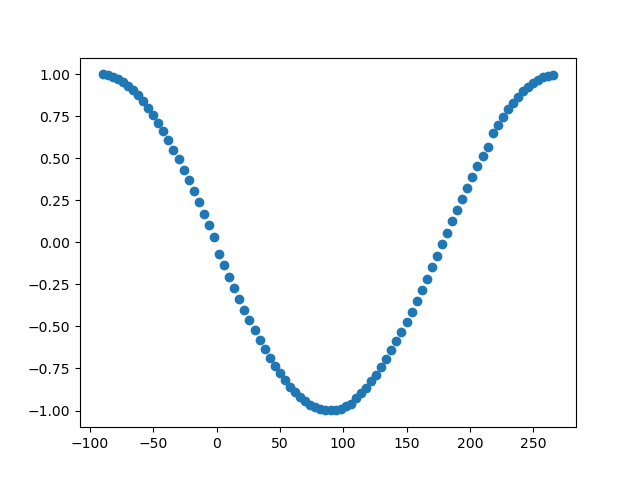
plt.scatter(np.arange(phase_min, phase_max, phase_step), conn_vals)
plt.show(block = True)
def calc_from_time_domain(signal_1, signal_2, frequency_sampling, nperseg, nfft, frequency_target):
return sfc.ic_td(signal_1, signal_2, frequency_sampling, nperseg, nfft)[1][frequency_target]
def calc_from_frequency_domain(signal_1, signal_2, frequency_sampling, nperseg, nfft, frequency_target):
seg_data_X = sfc._segment_data(signal_1, nperseg, pad_type = "zero") # pylint: disable=protected-access
seg_data_Y = sfc._segment_data(signal_2, nperseg, pad_type = "zero") # pylint: disable=protected-access
(bins, fd_signal_1) = sfc._calc_FFT(seg_data_X, frequency_sampling, nfft, window = "hanning") # pylint: disable=protected-access
(_, fd_signal_2) = sfc._calc_FFT(seg_data_Y, frequency_sampling, nfft, window = "hanning") # pylint: disable=protected-access
return sfc.ic_fd(fd_signal_1, fd_signal_2)[1][[np.argmin(np.abs(bins - frequency_target))]]
def calc_from_coherency_domain(signal_1, signal_2, frequency_sampling, nperseg, nfft, frequency_target):
(bins, coh) = sfc.cc_td(signal_1, signal_2, nperseg, "zero", frequency_sampling, nfft, "hanning")
return sfc.ic_cc(coh)[np.argmin(np.abs(bins - frequency_target))]
main()
The maximum score of imaginary coherence is dependent on the phase shift between two signals, hence it can only be interpreted relatively and never absolutely.