Direct Modulation Index#
The following example shows how to apply the dmi to estimate PAC.
import numpy as np
import matplotlib
matplotlib.use("Qt5agg")
import matplotlib.pyplot as plt
import finn.cfc.pac as pac
def generate_high_frequency_signal(n, frequency_sampling, frequency_within_bursts, random_noise_strength,
offset, burst_count, burst_length):
signal = np.random.normal(0, 1, n) * random_noise_strength
for burst_start in np.arange(offset, n, n/burst_count):
burst_end = burst_start + (burst_length/2)
signal[int(burst_start):int(burst_end)] = np.sin(2 * np.pi * frequency_within_bursts * np.arange(0, (int(burst_end) - int(burst_start))) / frequency_sampling)
return signal
def visualize(scores, best_fits, amplitude_signals, frequencies_between_bursts, tgt_frequency_between_bursts, high_freq_frame_offsets):
if(len(scores) < 5):
(_, axes) = plt.subplots(2, 2)
elif(len(scores) < 10):
(_, axes) = plt.subplots(3, 3)
elif(len(scores) < 17):
(_, axes) = plt.subplots(4, 4)
elif(len(scores) < 26):
(_, axes) = plt.subplots(5, 5)
else:
raise NotImplementedError
axes = np.reshape(axes, -1)
for (ax_idx, ax) in enumerate(axes):
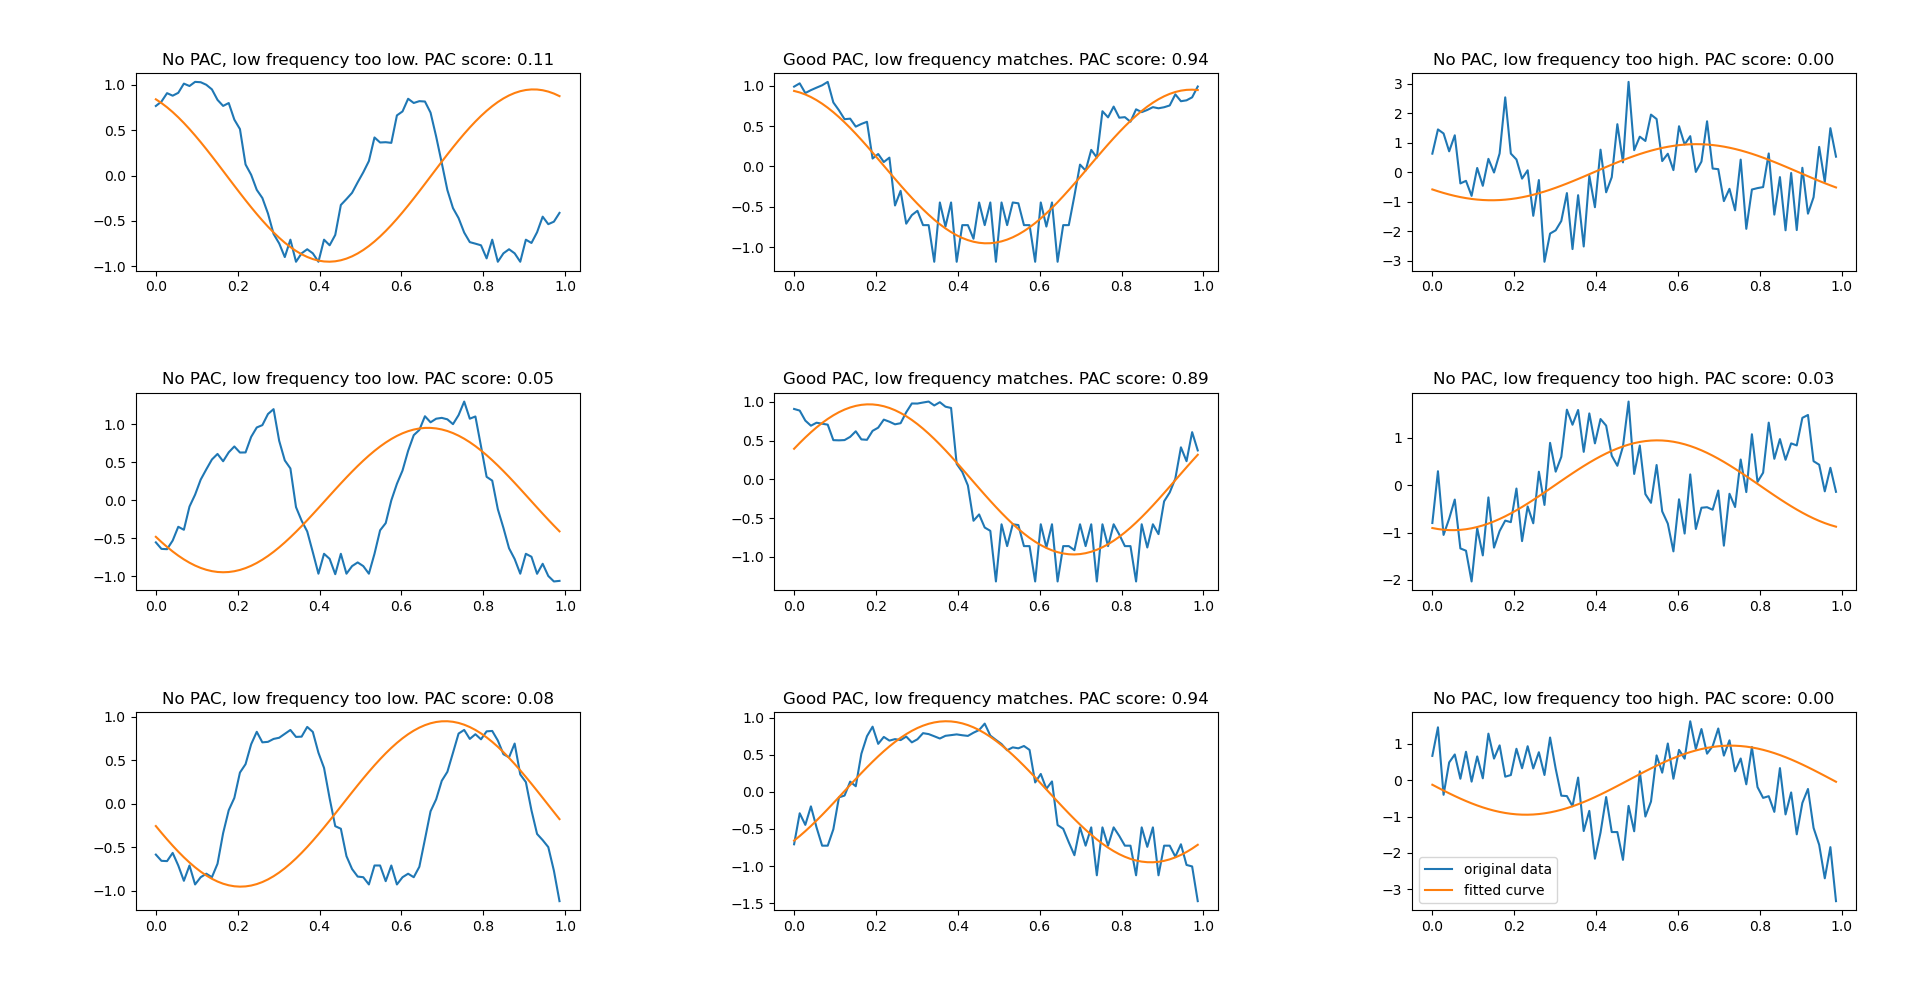
ax.plot(np.arange(0, 1, 1/len(amplitude_signals[ax_idx])), amplitude_signals[ax_idx], label = "original data")
ax.plot(np.arange(0, 1, 1/len(amplitude_signals[ax_idx])), best_fits[ax_idx], label = "fitted curve")
if (frequencies_between_bursts[int(ax_idx % len(high_freq_frame_offsets))] < tgt_frequency_between_bursts):
ax.set_title("No PAC, low frequency too low. PAC score: %2.2f" % (scores[ax_idx],))
elif (frequencies_between_bursts[int(ax_idx % len(high_freq_frame_offsets))] > tgt_frequency_between_bursts):
ax.set_title("No PAC, low frequency too high. PAC score: %2.2f" % (scores[ax_idx],))
else:
ax.set_title("Good PAC, low frequency matches. PAC score: %2.2f" % (scores[ax_idx],))
def main():
#Configure sample data
data_range = np.arange(0, 10000)
frequency_sampling = 1000
frequencies_between_bursts = [5, 10, 15]
tgt_frequency_between_bursts = 10
frequency_within_bursts = 200
high_freq_frame_offsets = [0, 20, 40]
#Configure noise data
random_noise_strength = 1
#Generate sample data
burst_length = frequency_sampling / tgt_frequency_between_bursts
burst_count = len(data_range) / frequency_sampling * tgt_frequency_between_bursts
high_freq_signals = [generate_high_frequency_signal(len(data_range), frequency_sampling, frequency_within_bursts,
random_noise_strength, high_freq_frame_offset, burst_count, burst_length) for high_freq_frame_offset in high_freq_frame_offsets]
low_freq_signals = [np.sin(2 * np.pi * frequency_between_bursts * data_range / frequency_sampling) for frequency_between_bursts in frequencies_between_bursts]
scores = list(); best_fits = list(); amplitude_signals = list()
for high_freq_signal in high_freq_signals:
for low_freq_signal in low_freq_signals:
tmp = pac.run_dmi(low_freq_signal, high_freq_signal, phase_window_half_size = 20, phase_step_width = 5)
scores.append(tmp[0]); best_fits.append(tmp[1]); amplitude_signals.append(tmp[2])
#visualization
visualize(scores, best_fits, amplitude_signals, frequencies_between_bursts, tgt_frequency_between_bursts, high_freq_frame_offsets)
plt.tight_layout()
plt.legend()
figManager = plt.get_current_fig_manager()
figManager.window.showMaximized()
plt.show(block = True)
main()
Using the direct modulation index, PAC has been detected only where there was a match between the high frequency component and the low frequency component: